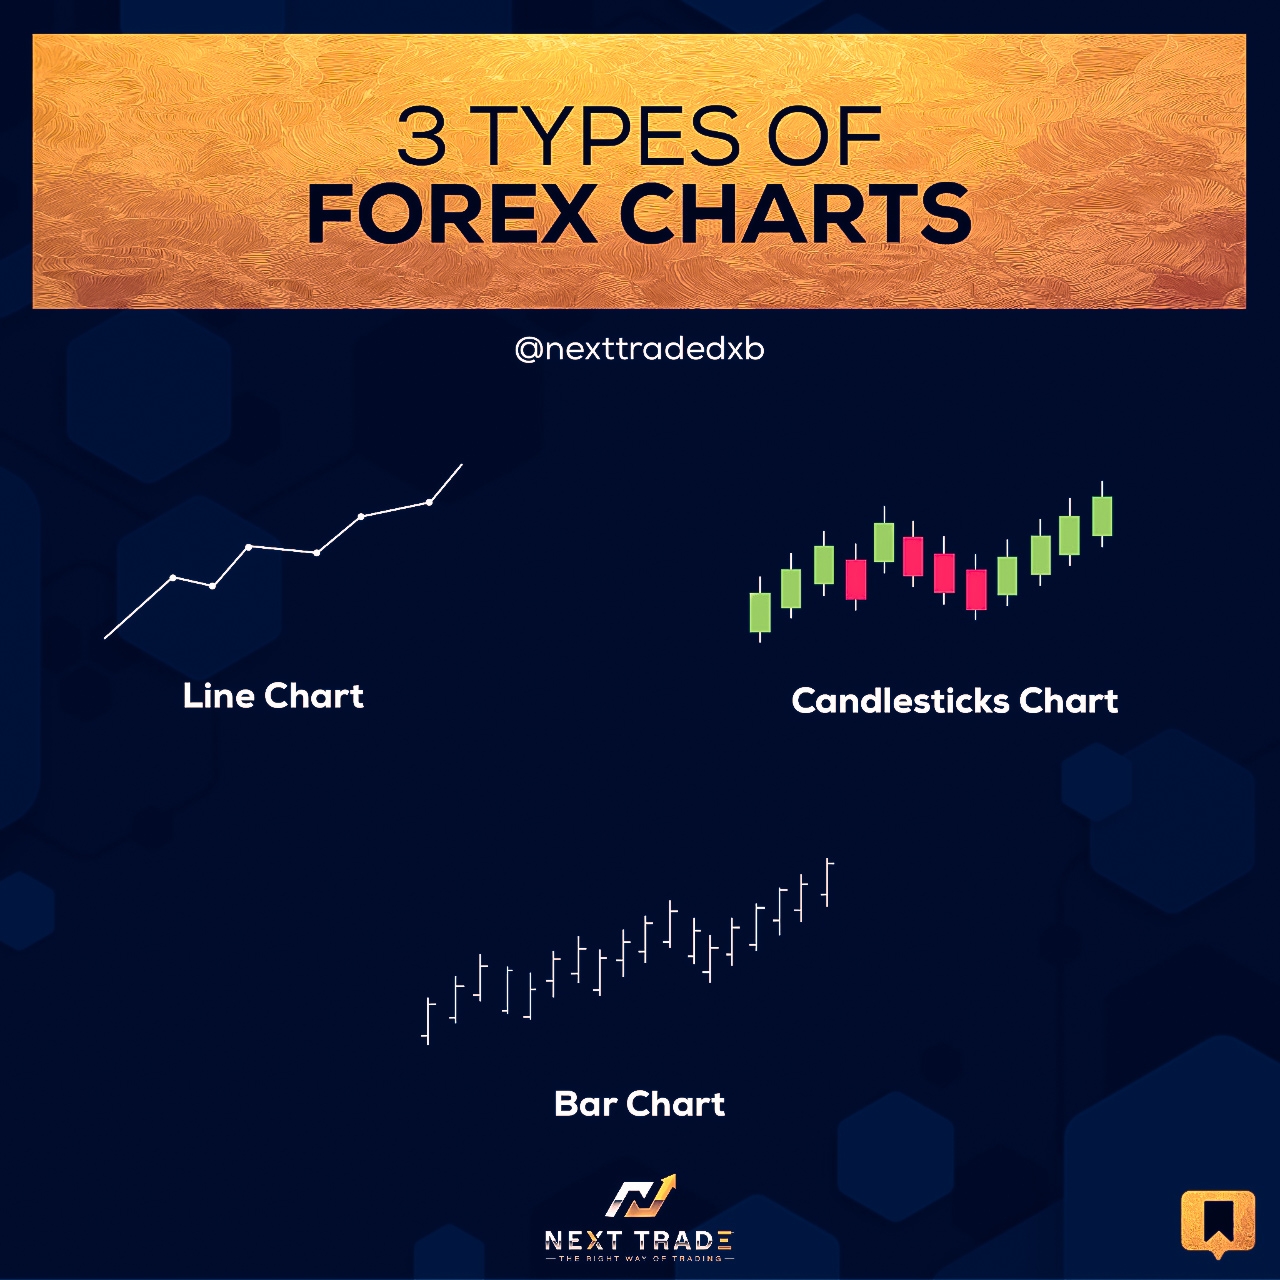
Why forex traders use candlestick charts

Forex traders often prefer candlestick charts to traditional charts because they offer a more visual representation of price movement. Candlestick charts are made up of green and red candlesticks, each representing a different price point. The body of each candlestick is typically filled with a different color, depending on whether the price movement was up or down. Candlestick charts are particularly useful for spotting price pattern trends. For example, if you’re looking to buy or sell a currency, you can use candlestick charts to identify patterns such as Fibonacci retracement levels and support and resistance levels. Candlestick charts also make it easy to see how the price of a particular currency has fluctuated over time.
One of the most popular tools used by forex traders is the candlestick chart. This type of chart is easy to see how the price of a particular currency has fluctuated over time. Candlestick charts are a great way to see the big picture, and can help you identify any patterns. Candlestick charts are different from traditional charts in a few key ways. First and foremost, candlestick charts show price changes over time. This means that you can see how the currency’s price has moved up and down over a given timeframe. Second, candlestick charts are designed to show you specific price movement patterns. This means that you can see not just the highs and lows, but the exact moments when the price rose or fell. Candlestick charts can be a valuable tool for forex traders. By understanding the different price movement patterns, you can better predict future movements. Additionally, candlestick charts can be a great way to see when the currency is in a good or bad trading environment. By understanding the patterns, you can more easily determine when to enter and exit trades.
Candlestick charts provide a concise and easily interpreted picture of market conditions at any given time. Candlestick charts are used more often by forex traders than traditional charts because they allow traders to see more data at a glance. By understanding the patterns, you can more easily determine when to enter and exit trades. There are a number of candlestick pattern types that forex traders use to make trading decisions.