Ichimoku Kinko Hyo
Background
There are many technical analysis tools available in the financial market. Regardless of the investment instrument (stock, bond, forex, commodities, etc), professional traders in the West (Europe and US) have started to pay more attention and respect to yet another traditional Japanese technical analysis indicator, (besides Candlesticks)- Ichimoku Kinko Hyo (also called Ichimoku in short or Ichimoku Cloud), due to its charting accuracy.
What exactly is Ichimoku ? What is its uniqueness and how does it different than other common analysis tools example moving averages?
Overview
Ichimoku was developed by a Japanese journalist, Ichimoku Sanjin (real name Goichi Hosada). In Japanese language, “Kinko” means “time & space at equilibrium point“ while “Hyo” means “chart”. In fact, there is a meaning for “Ichimoku” too which means “At A Glance” or “First Sight”.
Combining “Ichimoku Kinko Hyo” altogether, it simply means “Equilibrium Chart At A Glance”.
Ichimoku Kinko Hyo or ichimoku cloud is a trend-based system. It is extremely useful and effective when the market is trending. As compare to a standard candlestick charts,due to it contains more data points, it can provides a better picture of market condition and possible price action. Though it adapted series of moving averages, Ichimoku cloud analysis is different since its calculation is solely based on highs and lows instead of closing price in moving average.
Explanation
Ichimoku Kinko Hyo (IKH) is an indicator that assesses future price dynamics and determines future areas of support and resistance. Now we have a 3 in 1 for you all!
The word Ichimoku means “look”, Kinko means “balance” and Hyo means “graphic”. Putting the meanings together, it will look something like “Balanced look at the graph”. But what does it mean?
How to trade using Ichimoku Kinyo Hyo
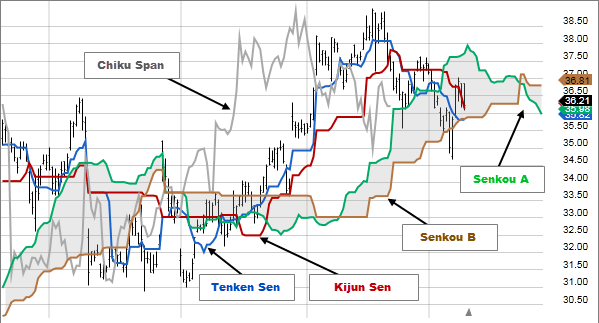
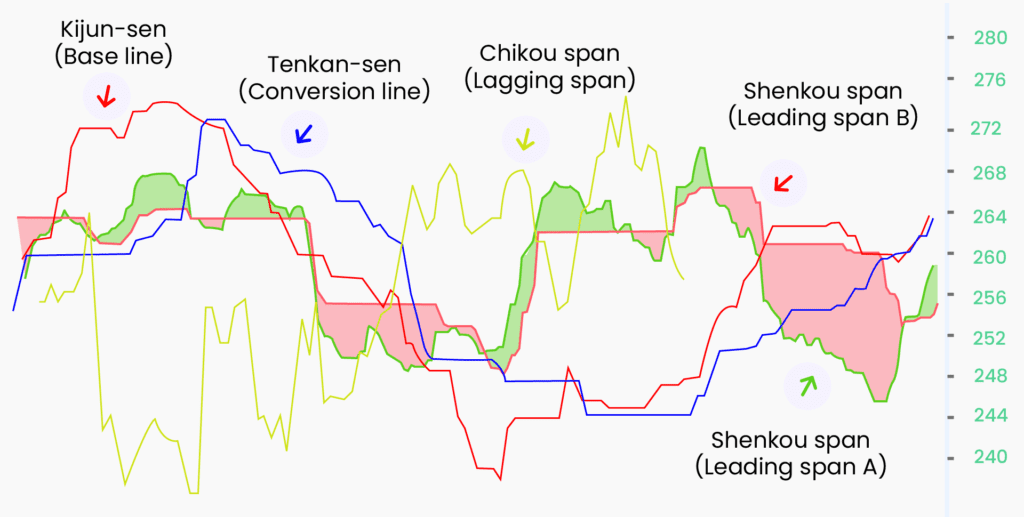
Let’s take a look at Senkou Span first. If the price is above the Senkou Span, the upper line serves as the first support level, while the lower line serves as a second level of support. If the price is below the Senkou Span range, the bottom line constitutes the first resistance level, while the top line serves as a second support level. If the price is below the Senkou Span range, the bottom line constitutes the first resistance level, while the upper line is the second resistance level. Right?
Meanwhile, Sen Kijun works as an indicator of future price movement. If the price is higher than the blue line, it may continue to go higher. If it is below the blue line, it may continue to fall. Sen Tekan is an indicator of market trend. If the red line is moving up or down, it indicates that the market is trending. If it moves horizontally, it signals that the market is ranging. Lastly, if the Chikou Span or the green line crosses the price from the bottom to the top, this is a buy signal. If the green line crosses the price from top to bottom, it is a sell signal.
If you have never seen this indicator, don’t get scared away, because it looks like a big mess. It looks scary and confusing. But if you are a new trader, learn to use this, because it will make you a disciplined trader. Other indicators are easy to understand, but are difficult to execute properly. This indicator is difficult to understand, if you are new, but is very easy to use it to execute trades in live markets.
Risk Disclaimer : This sharing is for education purpose only. Any opinions, news, research, analyses, prices, or other information contained on this website are provided as general market commentary, and do not constitute investment advice. Nexttradefx.in is not liable for any loss or damage, including without limitation, any loss of profit, which may arise directly or indirectly from use of or reliance on such information. Nexttradefx.in has taken reasonable measures to ensure the accuracy of the information on the website. The content on this website is subject to change at any time without notice.