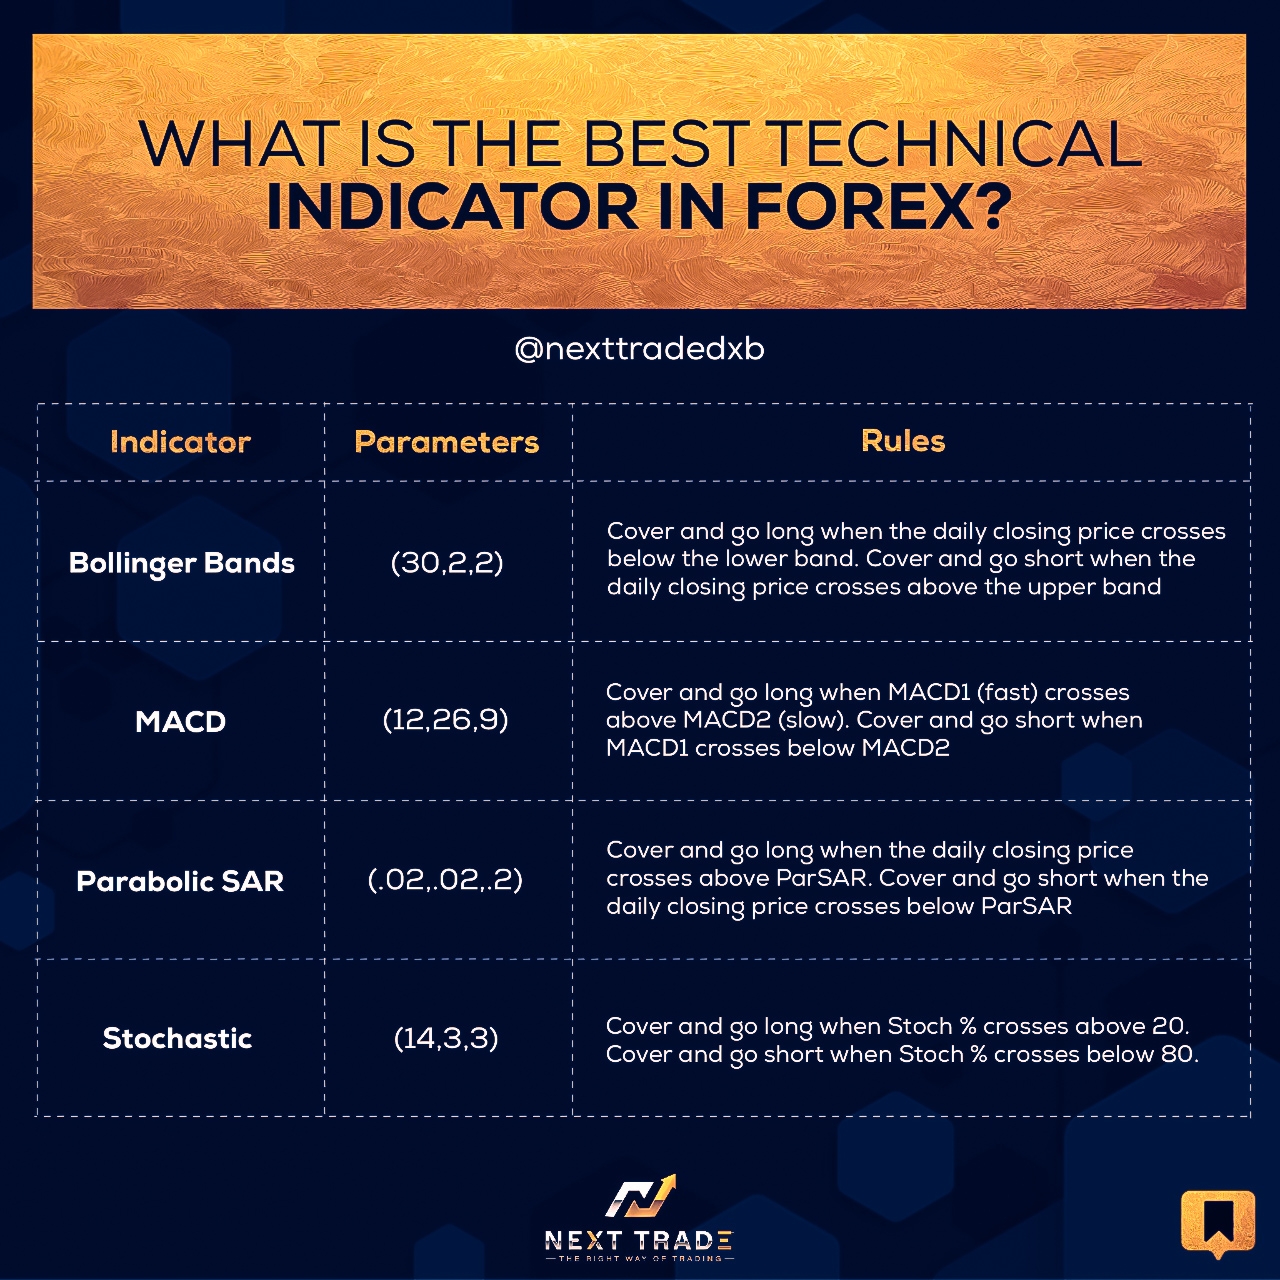
FX Indicators


Understanding Market Cycles and Trends : A market cycle is a periodicity in the Forex market characterized by waves of optimism and pessimism.
What are the main phases of a market cycle?
The three main phases of a market cycle are: the Golden Age (an optimistic phase), the Trough (a pessimistic phase), and the Wave (an intermediate phase).
What is an indicator? Simply put, An indicator is an electronic, computer-generated signal that is used to indicate a trend, modify positions, or provide other advice to a trader. It is a technical analysis tool that can be used to identify patterns. It is no secret that many traders use indicators when they are trading forex. These signals may lead you to make informed trading decisions.
What are the indicators used to identify market cycles?
There are several indicators used to identify market cycles (Trend), including the cycle length, internals (e.g. volume, prices, momentum, volatility), and external factors (e.g. economic indicators). When choosing an indicator, it is important to consider its purpose. Indicators can be leading or lagging and can be Technical, Fundamental or Mixed in nature. When it comes to choosing indicators, it is important to understand what you are looking for. Ideally, an indicator will provide you with timely and accurate information about the market. Additionally, an indicator that is user-friendly will allow you to make more informed trading decisions. For example, candlestick indicators use the prices of individual assets to indicate trends. Other indicators might use indicators such as moving averages, oscillators, or stochastic indicators. Additionally, some indicators will provide multiple signals at the same time. Technical indicators are used to identify short-term trends in the market. They are based on signals from the underlying instruments. They are often Technical indicators include moving averages, candlestick patterns, and Bollinger bands etc.
Different types of Indicators fall under the categories below.
Trend
Momentum
Volatility
Volume Indicator
Custom Indicators &
Sentiment indicators
testing data 2-11-2022
evdfvdfv fv
Embark on forex chart patterns by learning basics, recognizing key patterns,…
Candlestick charting visually represents price movements, using candle-shaped patterns to convey…

Copyright @ 2024 nexttradeforex.com, All Rights Reserved