Bar Chart

By Next trade


A bar chart is a visual representation of price movements in the financial markets. Each bar on the chart represents a specific time period, such as a day or an hour, and contains four crucial data points: the opening price, closing price, highest price (high), and lowest price (low) during that period. The vertical line represents the price range between the high and low, while horizontal lines extend from the left and right, indicating the opening and closing prices, respectively. Bar charts provide a concise overview of price action, making it easy for traders and analysts to identify trends, reversals, and key support/resistance levels. They are a fundamental tool in technical analysis, offering a historical perspective on market behavior and aiding decision-making for market participants.

good

Rated 4 out of 5
November 2, 2022

testing data 2-11-2022

demo

test data

Rated 3 out of 5
August 17, 2022

evdfvdfv fv

test

Related Content

Candlestick Charting Explained

Candlestick charting visually represents price movements, using candle-shaped patterns to convey…

12x Lessons
0.0
Line Charts Trading Strategy: Easy And…

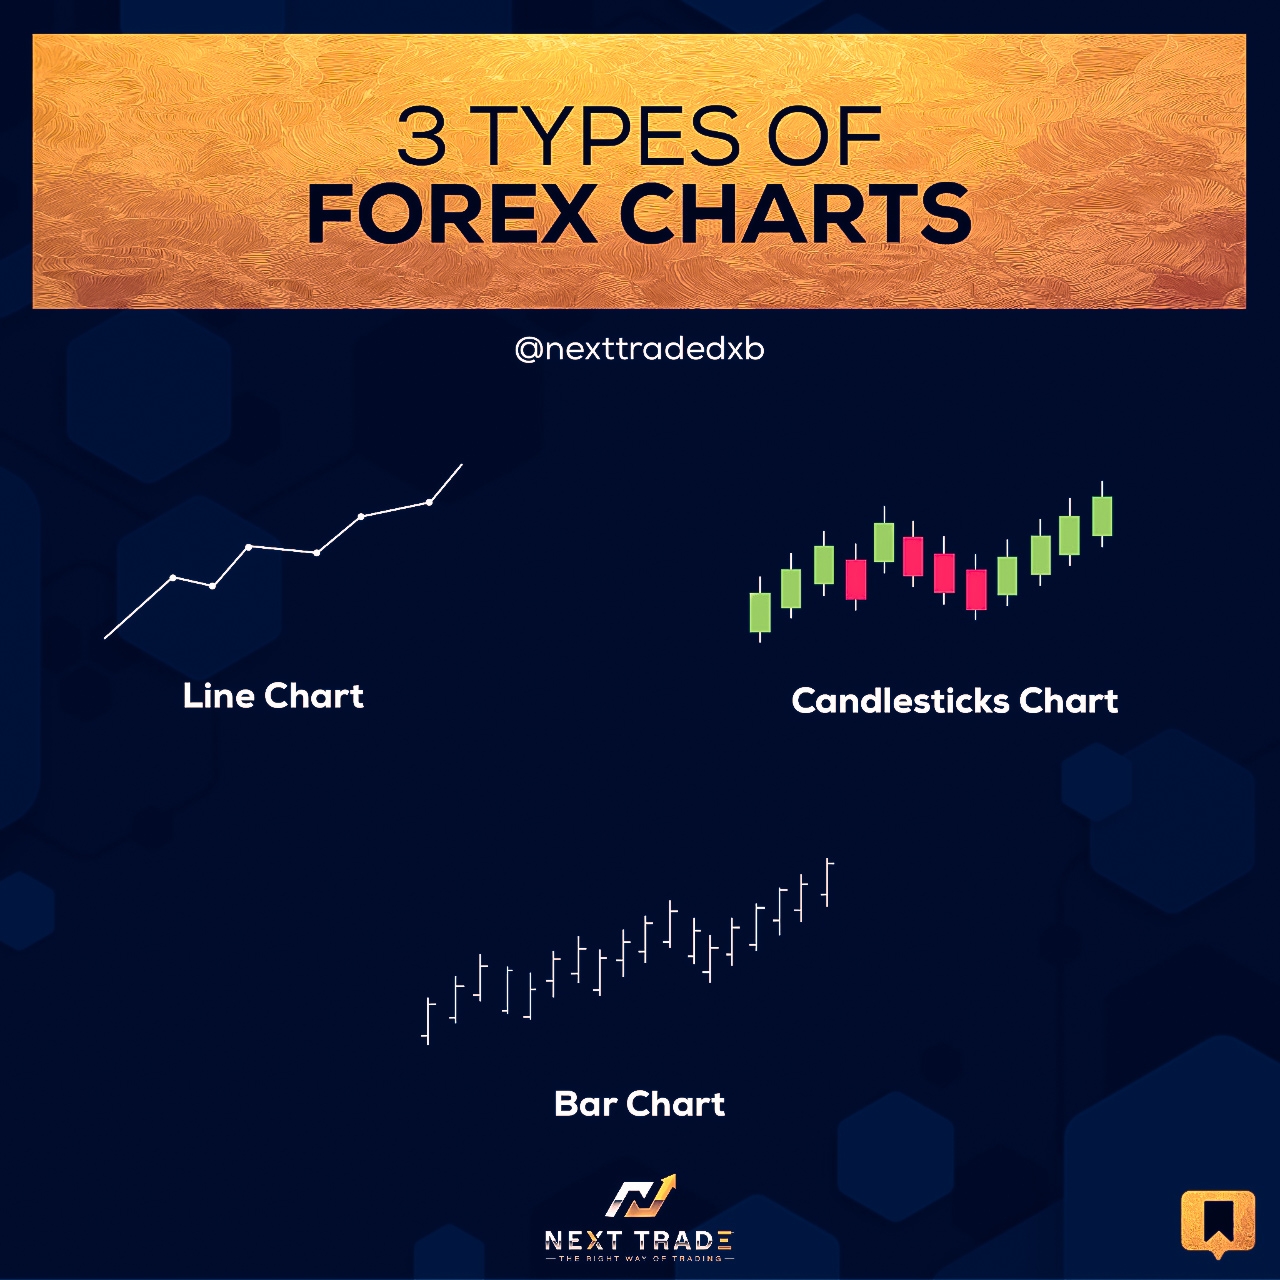
Line charts simplify trading with a straightforward approach, offering an easy…

12x Lessons
0.0
Are tick charts better?

Tick charts offer more granular price data, aiding in precise entry…

12x Lessons
0.0
What is a tick chart in…

A tick chart in forex displays price movements based on the…

12x Lessons
0.0
12x Lessons
0.0
What Tick Chart settings to use

Choose tick chart settings based on trading style; for day trading,…

12x Lessons
0.0
Footprint Chart

A Footprint chart visualizes order flow, displaying volume and price data…

12x Lessons
0.0
12x Lessons
0.0
12x Lessons
0.0
Why forex traders use candlestick charts

Forex traders use candlestick charts for visual clarity, quick trend identification,…

12x Lessons
0.0
12x Lessons
0.0
Candlestick vs Bar chart

Candlestick charts offer visual clarity with color-coded patterns, enhancing analysis compared…

12x Lessons
0.0
12x Lessons
0.0
Trading with Line Chart

Line charts simplify trading analysis, depicting price trends with clear lines,…

12x Lessons
0.0
12x Lessons
0.0
Footprint Trading Strategies

Footprint trading strategies leverage order flow data, analyzing imbalances and patterns…

12x Lessons
0.0
Point-and-Figure (P&F) Chart

Point-and-Figure (P&F) charts represent price movements using Xs and Os, simplifying…

12x Lessons
0.0
Renko Chart

A Renko chart displays price movements using bricks, making trends and…

12x Lessons
0.0
Heikin-Ashi candlesticks

Heikin-Ashi candlesticks use average price data, reducing market noise and providing…

12x Lessons
0.0
Candlestick Chart

A candlestick chart visually represents price movements, displaying open, high, low,…

12x Lessons
0.0
X